I have written about how the idea that bookmakers set odds to balance the books is a myth. Here I describe how economics explains how the odds are actually set. To do so, we need to start with basic microeconomics.
Pricing and Competition
Microeconomics textbooks usually start with the idea of perfect competition. This is when there are loads of firms and none of them are able to set a price different from the market. Competition among firms drives the price down to the cost of producing the product plus a small profit margin.
The sports betting industry is not perfectly competitive. There are lots of reasons for that. Licensing, regulation and the complexity of the modern sports betting industry are not consistent with there being a large number of firms competing heavily on price. And, in some places, like the US, the licensing process was almost designed to produce a highly uncompetitive industry: FanDuel and DraftKings handle about two-thirds of legal betting volume.
Customer frictions also act to reduce competition. Opening a new account involves sending in documents, waiting for approval, and setting up payment methods — not a process most people want to repeat again and again. Each account comes with its own password and two-factor authentication system. And since odds differences across bookmakers are small, the reward for having lots of accounts and shopping around is fairly small. Surveys report the typical American sports bettor as having two accounts, often just with the “big two”. Only 31% of US bettors say they shop for the best odds. Even in a market where it seems like there are many competitors, demand may not be very price sensitive.
So the right model for how odds are set is a model of imperfect competition. This is the situation where pricing is not so cut-throat that firms have no control over their prices. They can set their own price, knowing that the higher this price is, the lower their demand will be.
The Lerner Rule
Given the freedom to set their own price, how does a firm maximize profits? As they sell more units, they usually have to cut the price to attract additional customers, so the extra revenue from each sale – the marginal revenue – falls as output rises. And producing those extra units adds cost. At what point have they produced enough? Well, if their goal is to maximize profits, they don’t want the marginal revenue of the next unit they sell to be below its marginal cost. If producing one more widget costs you $5 but only brings in $4, you shouldn’t make it. The optimal point is where that last unit just breaks even: marginal revenue equals marginal cost. First derived by Antoine Augustin Cournot in 1838, today MR = MC is the most famous rule in microeconomics.
But that doesn’t tell us what exactly the profit-maximizing price is. For that, we use a rule created by Abba Lerner. Lerner was born in 1903 in Moldova, and grew up in a poor Jewish immigrant family in London’s rough-and-tumble East End. He worked in manual jobs, including as a machinist, and was largely self-taught in mathematics before eventually studying at the London School of Economics at the age of 26.
In 1934, Lerner showed how Cournot’s condition implied a powerful result: a profit-maximizing firm sets price as a markup over marginal cost, and the size of that markup depends on its elasticity of demand. Elasticity is the percent decline in the quantity a firm will sell when it raises its price by one percent. If a firm is faced with highly price-sensitive customers, then it has to set low prices, while firms with customers whose demand is not that sensitive to price can set a high markup and make big profits.
Applying Lerner’s Idea to Sports Betting
MR = MC can be applied directly to a bookmaker setting odds. If they set higher odds, then they will attract more bets. That’s marginal revenue. But if those bets win, the higher odds mean they have to pay out more. That’s marginal cost. The profit-maximizing odds will balance those elements.
That describes a condition for odds to maximize profits, but it is Lerner’s formula that says precisely what those odds should be. A 2021 paper by economist, Maurizio Montone showed that a bookmaker’s profits were maximized by setting odds as a fraction of the odds that would imply zero profits.And this fraction depended on the elasticity of demand for bets relative to odds.
If the bookmaker believes customer demand is not that sensitive to the odds, then they will set low odds. If they know they face price-sensitive customers, then they set better odds.
This insight explains some basic patterns in the sports betting industry. The big international “sharp” bookmakers post the best odds because their customers are incredibly price sensitive. Retail betting customers do typically want better odds but also prize things like convenience and a good UI on their app. They tend to be less price sensitive.
But what actually determines the demand for bets and thus elasticity? The key is to understand that sports betting is driven by disagreement.
Disagreement, the Wisdom of Crows and the Favorite-Longshot Bias
You see someone place a bet on the Red Sox to beat the Yankees. Why do people bet? It may be because they enjoy the thrill of a bet. But why did they pick the Red Sox and not the Yankees? Part of the answer will be that they think the Red Sox are the better bet at the quoted odds.
The bookmaker has a probability in mind when they set the odds. As we have described, they will have set the odds so they believe pD < 1. In other words, according to their belief about the probability, they have an edge and bettors will lose on average.
But everyone has their own subjective assessment of this probability and some people will think that pD >1 if their probability assessment is high enough.
Assume people take a bet at decimal odds of D if they think pD >1, so they believe they have an edge. Consider what this means for the demand for bets. Suppose the Buffalo Bills are playing Miami Dolphins and they have a 70% chance of winning (so p = 0.7). Let’s assume “the wisdom of crowds” so that, on average, people are right about the probability but beliefs vary equally upwards and downwards by 0.1. In other words, the most pessimistic person about the Bills thinks that p = 0.6, so the Dolphins have a 40% chance of winning, and the most optimistic person about the Bills thinks that p = 0.8, so the Dolphins have a 20% chance of winning.
People who are pessimistic about a bet don’t place it, so bookmakers don’t need to care about them. Their demand comes from optimists. Let’s see how far they can get these optimists to stretch. The fair decimal odds on Buffalo are 1/0.7 = 1.43. At those odds, you would on average break even placing those bets. The biggest optimist about the Bills, however, would accept odds of 1/0.8 = 1.25. At those odds, their average payout would be 0.7(1.25) = 0.875. Their over-optimism will cost them 12.5% of their money if they keep placing bets like this.
But consider the person who is most optimistic about the Dolphins. The fair decimal odds on Miami are 1/0.3 = 3.33. But the super-optimist would accept odds of 1/0.4 = 2.5. They will get an average payout of 0.3(2.5) = 0.75, so they will lose 25% of their money placing bets like this.
This illustrates a greater point: disagreement makes demand for longshot bets less elastic than demand for bets on favorites.
These considerations about the most optimistic bettors are not just illustrative. You can show that implementing Lerner’s formula for bookmakers implies the odds are a geometric average of the odds at which the bookmaker would make zero profits and the odds the most optimistic bettor would accept. So those extreme optimists are ultimately what drives the pricing.
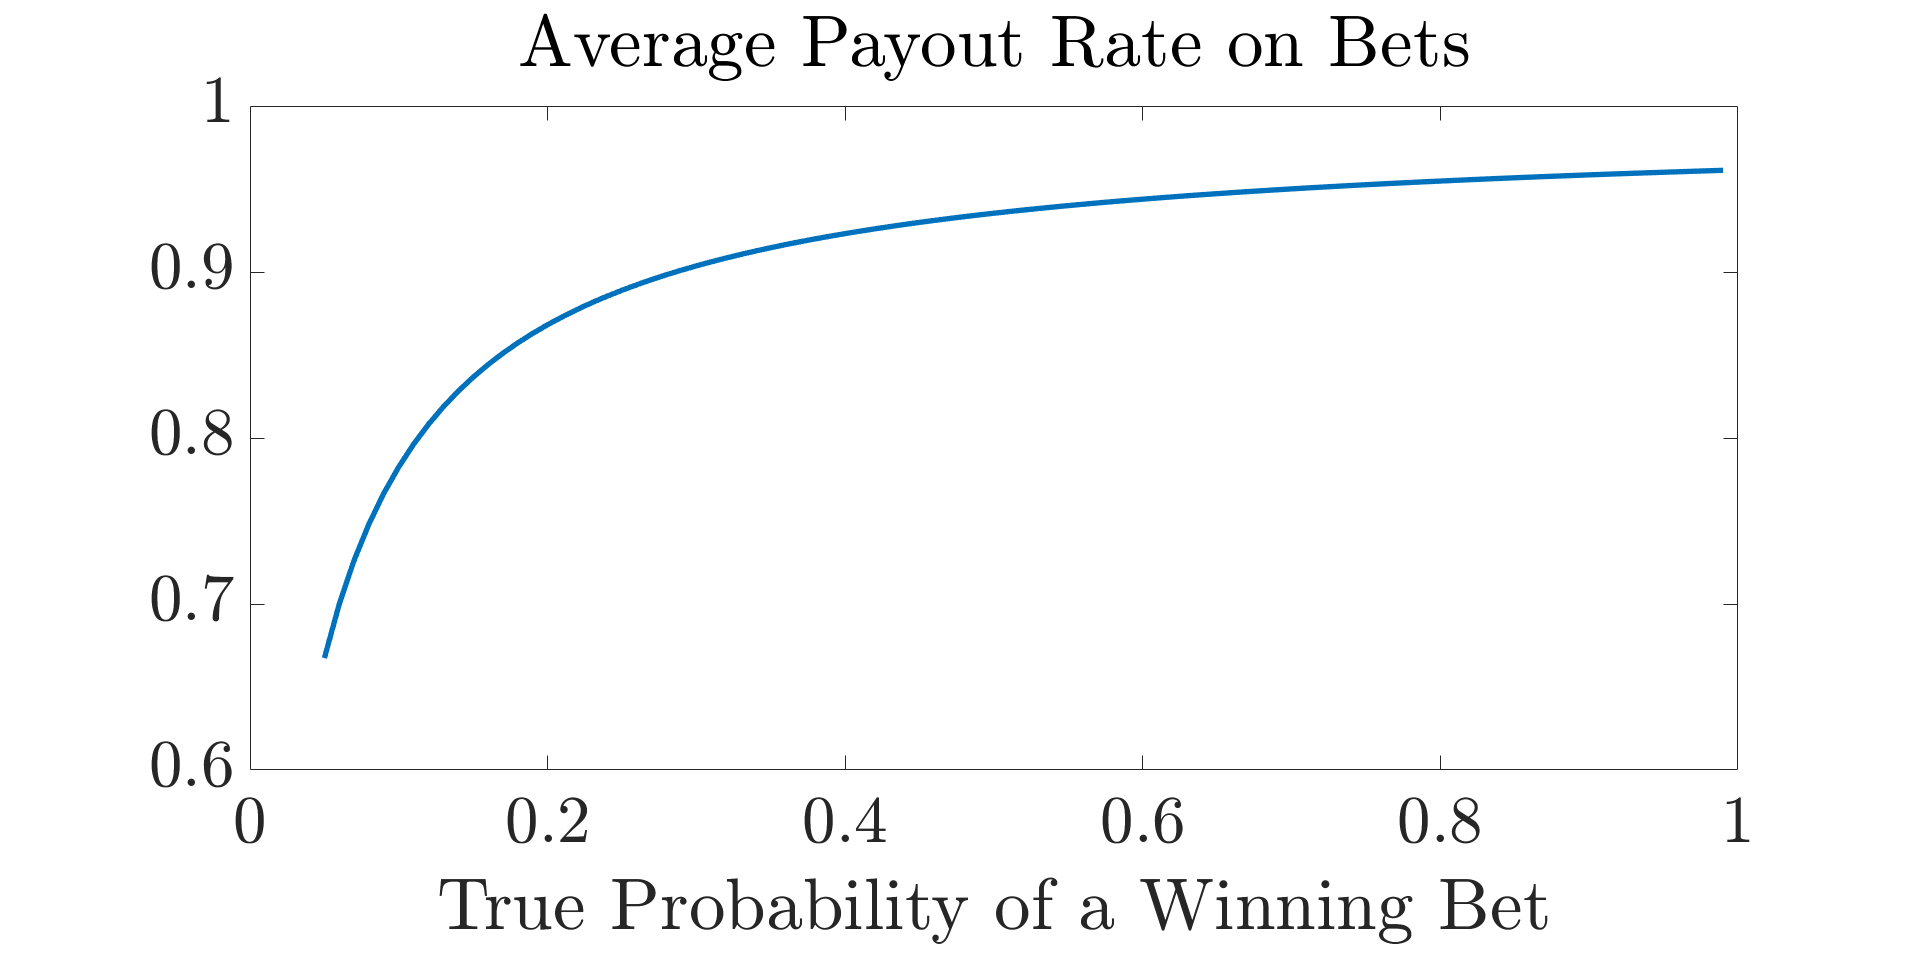
You don’t need to assume huge amounts of disagreement to get significantly worse pricing for longshot bets than for favorites. The figure below shows the average payout rate on bets implied by the Lerner formula for a range of win probabilities going from 5% to 99% when the maximum over-optimism of 6%. So, for example, if the bet has a 50% chance of winning, the biggest optimist thinks its chance is 56%. Even this modest amount of disagreement implies a striking nonlinear pattern in which payout rates on bets fall sharply as the probability of winning falls. With this pricing rule, the betting market is not strongly efficient because the bookmaker sets a different profit margin for each bet in a contest.
The chart below implements the Lerner formula with a maximum over-optimism of 6% and assuming bookmaker’s have costs equal to 2% of the amounts wagered. The model predicts a striking favorite-longshot bias pattern.
The Odds are Wrong, Even When the Public Is Right
The model has an important prediction: It implies betting markets are not strongly efficient. That has implications for translating odds into probabilities. With strong efficiency, you can calculate the ratio of the probabilities from the ratio of the odds. But you can’t do that when each bet has a different profit margin.
In a simple sense, the odds are biased. They don’t tell you the true probabilities. Note though, that we have not assumed the public is biased. Our assumptions above assumed that on average the public was correct. Disagreement means there are people who are too optimistic about bets, and bookmakers can exploit these people’s biases, even if the public is, on average, well informed.
It also means that the standard calculation of the bookmaker’s profit margin (even when done correctly) does not tell you the margin on your bet. There is no single number for the margin on your bet, because each outcome has a different margin. But you can show that favorite-longshot bias implies the standard calculation gives a profit margin that is lower than the actual average margin across each of the bets, giving them equal weights. In this sense, the standard calculation is hiding that the odds are worse than they look.
Evidence
There is tons of evidence in Fine Margins showing many betting markets exhibit this favorite-longshot bias. Two quick examples here come from Joseph Buchdahl’s incredible free resources www.football-data.co.uk and www.tennis-data.co.uk. These sites record the average odds and outcomes on many different football leagues around the world and for all ATP and WTA tennis matches.
Here is the average payout on about 450,000 different soccer bets, sorted into 10 odds deciles going from the lowest odds to the highest odds.
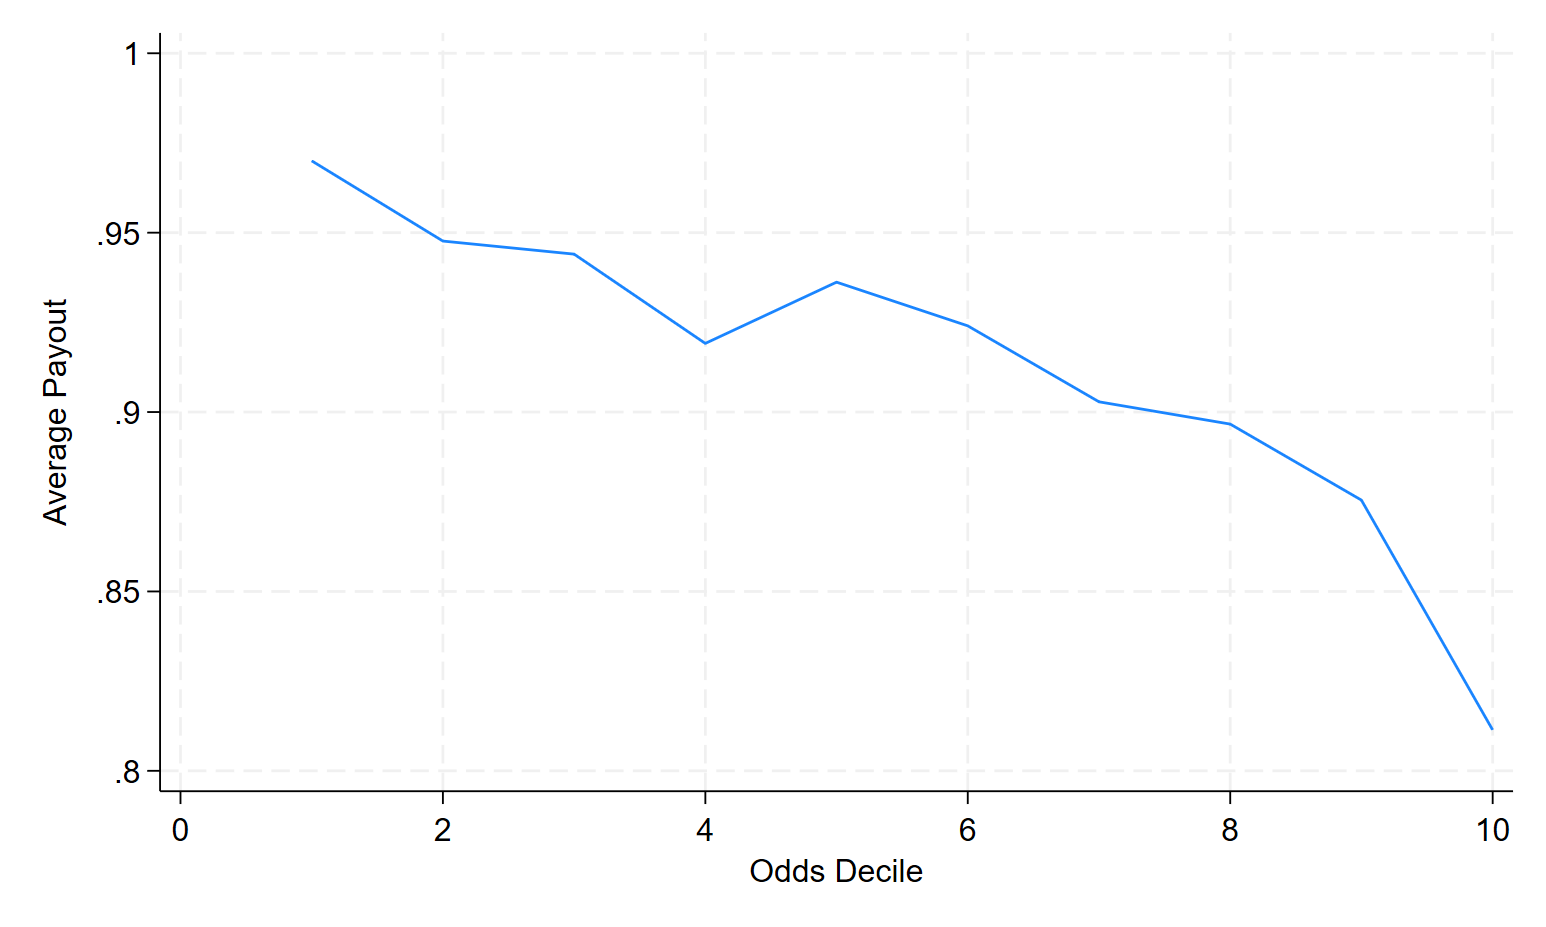
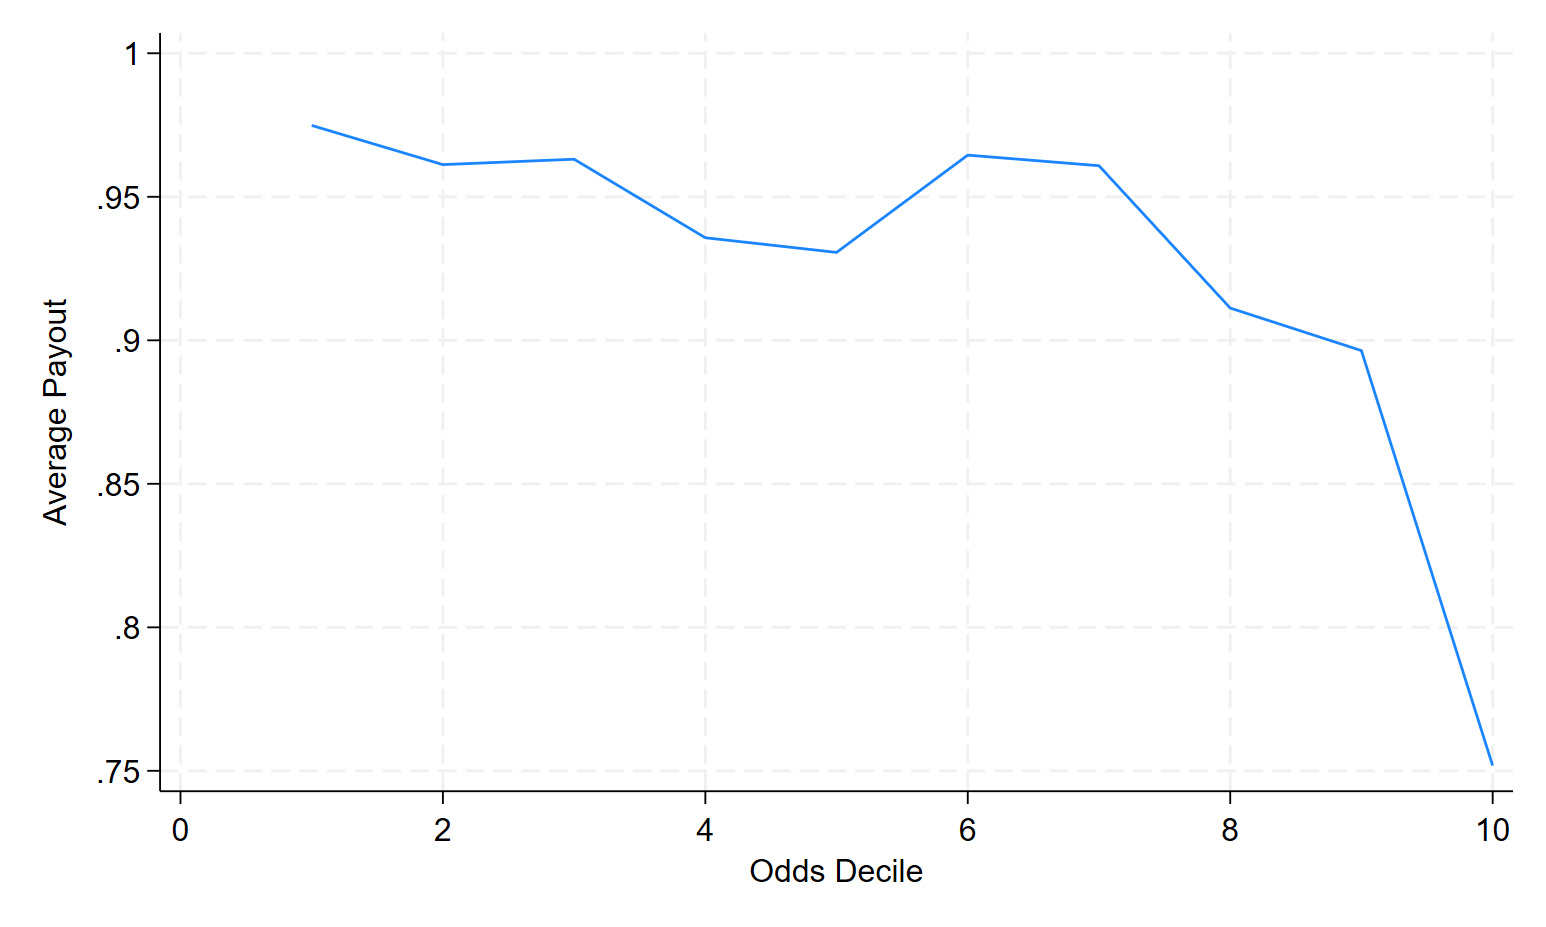
And here is the same chart for about 250,000 bets on tennis. Both cases show that average losses accelerate as the odds rise with losses on extreme underdogs roughly matching the predictions of our Lerner pricing rule model.
Implications
So, next time you see some betting odds just before a game starts, don’t just assume they are somehow a measure of “the truth”, revealing all the information about how likely the bet is to win. Bookmakers are not seeking truth, they are seeking profits. The odds are just prices chosen by profit-maximizing firms facing customers with different beliefs and different willingness to pay. Economics predicts how those prices are set—and explains why bookmakers earn larger profit margins on some bets than others.
Fine Margins explores in detail how this framework explains the evidence on how sports betting markets work, from when the favorite-longshot bias applies (and when it doesn’t), to how you do betting on draws in soccer, why you lose more betting on events with big fields and plenty more.